 Aggregate subscribers grew annually by 20{e1f18614b95d3cd6e4b3128e1cd15d99b042a60a5a19c19b7a8e07e7495efa10} to 130 million
Etisalat announced today its consolidated financial statements for the quarter ending 30th September 2012. Etisalat saw net profit after federal royalty increase to AED 2.2 billion, up 28{e1f18614b95d3cd6e4b3128e1cd15d99b042a60a5a19c19b7a8e07e7495efa10} year on year. Consolidated revenues remained flat at AED 8.0 billion, while revenue from international operations grew to AED 2.4 billion, up 7{e1f18614b95d3cd6e4b3128e1cd15d99b042a60a5a19c19b7a8e07e7495efa10}.
Financial Highlights for Q3 2012
- Aggregate subscribers grew annually by 20{e1f18614b95d3cd6e4b3128e1cd15d99b042a60a5a19c19b7a8e07e7495efa10} to 130 million;
- Net Profit after Federal Royalty increased by 28{e1f18614b95d3cd6e4b3128e1cd15d99b042a60a5a19c19b7a8e07e7495efa10} to AED 2.2 billion;
- Consolidated revenues remained flat at AED 8.0 billion;
- Revenue from international operations grew to AED 2.4 billion while their contribution to the top-line reached 30{e1f18614b95d3cd6e4b3128e1cd15d99b042a60a5a19c19b7a8e07e7495efa10};
- Consolidated EBITDA increased by 9{e1f18614b95d3cd6e4b3128e1cd15d99b042a60a5a19c19b7a8e07e7495efa10} to AED 4.2 billion while EBITDA margin improved 4pts to 53{e1f18614b95d3cd6e4b3128e1cd15d99b042a60a5a19c19b7a8e07e7495efa10};
- Sold 775 million shares in PT XL Axiata TbK, representing 9.1{e1f18614b95d3cd6e4b3128e1cd15d99b042a60a5a19c19b7a8e07e7495efa10} of XL’s issued share capital;
- Consolidated capital spending declined by 11{e1f18614b95d3cd6e4b3128e1cd15d99b042a60a5a19c19b7a8e07e7495efa10} to AED 0.9 billion, representing 11{e1f18614b95d3cd6e4b3128e1cd15d99b042a60a5a19c19b7a8e07e7495efa10} of the consolidated revenues;
- Improved financial flexibility with net cash balance of AED 7.2 billion; and
- Net Profit after Federal Royalty increased by 19{e1f18614b95d3cd6e4b3128e1cd15d99b042a60a5a19c19b7a8e07e7495efa10} quarter or quarter
Key Developments during Q3 2012
- Etisalat UAE successfully completed the highest 4G LTE speed test in the world, reaching speeds of 300 Mbps;
- Launched the new LTE mobile Wifi device allowing customers the opportunity to enjoy the most reliable wireless internet access at all times;
- Launched UAE’s First Islamic Telecom Card in partnership with Abu Dhabi Islamic Bank (ADIB) and Visa International;
- Etisalat Misr launched its exclusive first 3G Android-powered smartphone.
- Etisalat UAE commenced SIM registrations process to its customers in the UAE;
- Etisalat Nigeria introduced “Easywallet”, a secure and user-friendly SIM application platform for mobile money payments and transfers.
- Etisalat Information Services (eIS), a business unit of Etisalat Services Holding announced the first Arabic domain name for the Yellow Pages in the Middle East.
- Etisalat Group won four Gold Stevie award in the four categories entered, including Executive of the Year – Telecommunications, Most Innovative Company of the Year in the Middle East and Africa, Best New Product or Service of the Year, and Corporate Social Responsibility Program of the Year in the Middle East and Africa.
CEO’s Message
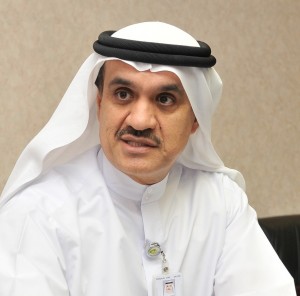
Ahmad Abdulkarim Julfar, group chief executive officer, Etisalat, commented: “Over the past three months, we have recorded significant growth in our international operations, despite regional socio-economic tensions, and we are pleased with the developments we have made across our key markets, specifically in the Kingdom of Saudi Arabia, Egypt and West Africa, as well as Afghanistan and Sri Lanka. “The positive results that we have achieved from our international operations reflect the investment that we have put in to our markets, helping us increase customer retention and acquisition, as well as reinforcing our commitment to delivering new technologies and services across our global customer base. “Etisalat has strong competitive positioning across our 15 markets of operations in the Middle East, Africa and Asia, having built and invested in the networks of the future, including FTTH and LTE in countries like the UAE and KSA, or being the first provider of 3G services in Pakistan and Afghanistan, and we will continue to study means to enhance our services to existing customers, and look at expanding in other markets should the right opportunities arise. “Our focus moving forward will be on developing the level of service and meeting the expectations and demands of our customers in the UAE and our key markets, as well as data services. We are committed to building the right partnerships with key players to deliver applied services that will our customers’ lives for the better.”
Subscribers
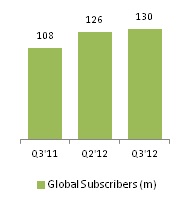
Etisalat Group aggregate subscriber number grew to 130 million by end of September 2012 representing YoY growth of 20{e1f18614b95d3cd6e4b3128e1cd15d99b042a60a5a19c19b7a8e07e7495efa10} and QoQ growth of 2{e1f18614b95d3cd6e4b3128e1cd15d99b042a60a5a19c19b7a8e07e7495efa10}. The Group reported strong net additions of 22 million subscribers as a result of growth across all of our operations. In the UAE active subscriber base grew to 9.0 million subscribers representing YoY growth of 8{e1f18614b95d3cd6e4b3128e1cd15d99b042a60a5a19c19b7a8e07e7495efa10} and QoQ growth of 1{e1f18614b95d3cd6e4b3128e1cd15d99b042a60a5a19c19b7a8e07e7495efa10}. Mobile subscribers grew to 7 million representing a YoY growth of 11{e1f18614b95d3cd6e4b3128e1cd15d99b042a60a5a19c19b7a8e07e7495efa10}. Fixed line subscribers reached 1.1 million representing YoY decline of 7{e1f18614b95d3cd6e4b3128e1cd15d99b042a60a5a19c19b7a8e07e7495efa10}. However, This decline is due to the successful migration of customers to eLife segment (double play and triple play) that grew by 61{e1f18614b95d3cd6e4b3128e1cd15d99b042a60a5a19c19b7a8e07e7495efa10} to 0.48 million subscribers. Internet subscribers grew by 9{e1f18614b95d3cd6e4b3128e1cd15d99b042a60a5a19c19b7a8e07e7495efa10} to 0.8 million. Africa cluster consolidated subscriber base grew to 11 million at the end of September 2012 representing YoY growth of 29{e1f18614b95d3cd6e4b3128e1cd15d99b042a60a5a19c19b7a8e07e7495efa10} and QoQ growth of 13{e1f18614b95d3cd6e4b3128e1cd15d99b042a60a5a19c19b7a8e07e7495efa10}. While Asia cluster consolidated subscriber base grew to 8.2 million at the end of September 2012 representing QoQ growth of 6{e1f18614b95d3cd6e4b3128e1cd15d99b042a60a5a19c19b7a8e07e7495efa10} while declined YoY by 3{e1f18614b95d3cd6e4b3128e1cd15d99b042a60a5a19c19b7a8e07e7495efa10} as year 2011 included the subscriber numbers of Indian operation that was deconsolidated in March 2012.
Revenues
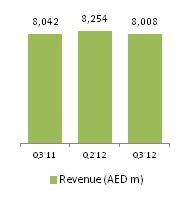
Consolidated revenues during the third quarter of FY2012 reached AED 8,008 million representing a slight decline of 0.4{e1f18614b95d3cd6e4b3128e1cd15d99b042a60a5a19c19b7a8e07e7495efa10} in comparison to the same period of last year. The contribution from international consolidated operations grew to 30{e1f18614b95d3cd6e4b3128e1cd15d99b042a60a5a19c19b7a8e07e7495efa10} of consolidated revenues as compared to 28{e1f18614b95d3cd6e4b3128e1cd15d99b042a60a5a19c19b7a8e07e7495efa10} contribution a year ago. This revenue growth is across all clusters. In Egypt revenues grew by 9{e1f18614b95d3cd6e4b3128e1cd15d99b042a60a5a19c19b7a8e07e7495efa10} to AED 1,301 million in comparison to the same period of last year and grew by 3{e1f18614b95d3cd6e4b3128e1cd15d99b042a60a5a19c19b7a8e07e7495efa10} quarter-over-quarter. Revenues growth was mainly driven by customer acquisition and growth in mobile data segment. Africa cluster consolidated revenues grew to AED 689 million representing an increase of 2{e1f18614b95d3cd6e4b3128e1cd15d99b042a60a5a19c19b7a8e07e7495efa10} in comparison to the same period of last year. This revenue growth is mainly attributed to the operations in Benin, Gabon, Togo and Canar. In Asia cluster, consolidated revenues grew to AED 408 million representing a growth of 10{e1f18614b95d3cd6e4b3128e1cd15d99b042a60a5a19c19b7a8e07e7495efa10} in comparison to the same period of last year. Growth is mainly driven by subscriber uptake in both Etisalat Afghanistan and Sri Lanka.
Operating Expenses
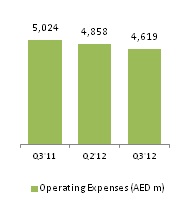
Consolidated operating expenses were AED 4,619 million in the third quarter, compared to AED 5,024 million in the year-ago period and AED 4,858 million in the second quarter of 2012. This represents an improvement of 8{e1f18614b95d3cd6e4b3128e1cd15d99b042a60a5a19c19b7a8e07e7495efa10} year-over-year, while as a percentage of revenues an improvement of 5 points to 58{e1f18614b95d3cd6e4b3128e1cd15d99b042a60a5a19c19b7a8e07e7495efa10}. Key components of operating expenses are: Staff expenses increased to AED 1,079 million representing a year-over-year increase of 6{e1f18614b95d3cd6e4b3128e1cd15d99b042a60a5a19c19b7a8e07e7495efa10}, while as a percentage of revenues remained flat at 13{e1f18614b95d3cd6e4b3128e1cd15d99b042a60a5a19c19b7a8e07e7495efa10}. Direct cost of Sales decreased by 9{e1f18614b95d3cd6e4b3128e1cd15d99b042a60a5a19c19b7a8e07e7495efa10} to AED 1,466 million, while as a percentage of revenues decreased to 18{e1f18614b95d3cd6e4b3128e1cd15d99b042a60a5a19c19b7a8e07e7495efa10} in comparison to 20{e1f18614b95d3cd6e4b3128e1cd15d99b042a60a5a19c19b7a8e07e7495efa10} last year. Depreciation and Amortization expense decreased by 4{e1f18614b95d3cd6e4b3128e1cd15d99b042a60a5a19c19b7a8e07e7495efa10} to AED 833 million. As a percentage of revenues, it declined by 1pts to 10{e1f18614b95d3cd6e4b3128e1cd15d99b042a60a5a19c19b7a8e07e7495efa10}. Other operating expenses declined by 19{e1f18614b95d3cd6e4b3128e1cd15d99b042a60a5a19c19b7a8e07e7495efa10} to AED 1,241 million. As a percentage of revenues, it decreased by 4 points to 16{e1f18614b95d3cd6e4b3128e1cd15d99b042a60a5a19c19b7a8e07e7495efa10} in comparison to 19{e1f18614b95d3cd6e4b3128e1cd15d99b042a60a5a19c19b7a8e07e7495efa10} last year.
EBITDA
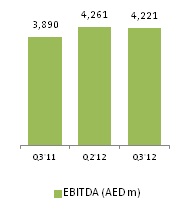
Consolidated EBITDA grew to AED 4,221 million representing a year-over-year growth of 9{e1f18614b95d3cd6e4b3128e1cd15d99b042a60a5a19c19b7a8e07e7495efa10}. EBITDA growth was mainly due to more effective cost management that led to lower network cost, direct cost of sales and project based expenses. EBITDA margin improved to 53{e1f18614b95d3cd6e4b3128e1cd15d99b042a60a5a19c19b7a8e07e7495efa10}, representing a 4 points increase in comparison to last year. In the UAE, effective cost optimization efforts boosted EBITDA level. EBITDA increased year-over-year by 4{e1f18614b95d3cd6e4b3128e1cd15d99b042a60a5a19c19b7a8e07e7495efa10} to AED 3,291 million leading to EBITDA margin of 60{e1f18614b95d3cd6e4b3128e1cd15d99b042a60a5a19c19b7a8e07e7495efa10} in comparison to 56{e1f18614b95d3cd6e4b3128e1cd15d99b042a60a5a19c19b7a8e07e7495efa10} of the same period of last year. EBITDA of international consolidated operations increased year-over-year by 25{e1f18614b95d3cd6e4b3128e1cd15d99b042a60a5a19c19b7a8e07e7495efa10} to AED 771 million resulting in 18{e1f18614b95d3cd6e4b3128e1cd15d99b042a60a5a19c19b7a8e07e7495efa10} contribution to group EBITDA. In Egypt, EBITDA increased by 7{e1f18614b95d3cd6e4b3128e1cd15d99b042a60a5a19c19b7a8e07e7495efa10} to AED 483 million and EBITDA margin marginally declined by 1 point to 37{e1f18614b95d3cd6e4b3128e1cd15d99b042a60a5a19c19b7a8e07e7495efa10}. In Africa cluster, EBITDA grew year-over-year by 10{e1f18614b95d3cd6e4b3128e1cd15d99b042a60a5a19c19b7a8e07e7495efa10} to AED 209 million and EBITDA margin increased to 30{e1f18614b95d3cd6e4b3128e1cd15d99b042a60a5a19c19b7a8e07e7495efa10} representing 2 points improvements in comparison to the same period of last year. In Asia cluster, EBITDA increased year-over-year by more than four times to AED 78 million and EBITDA margin increased by 26 points to 19{e1f18614b95d3cd6e4b3128e1cd15d99b042a60a5a19c19b7a8e07e7495efa10} in comparison to the same period of last year. EBITDA continue to be impacted by the deconsolidation of the Indian operation that occurred in March of 2012.
Net Profit and EPS
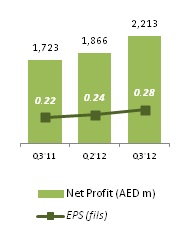
Consolidated net profit post Federal Royalties increased year-over-year by 28{e1f18614b95d3cd6e4b3128e1cd15d99b042a60a5a19c19b7a8e07e7495efa10} to AED 2,213 million which was achieved through higher EBITDA in addition recognizing profit on disposal of asset. On September, Etisalat sold 775 million shares of its investment in XL Axiata, representing 9.10{e1f18614b95d3cd6e4b3128e1cd15d99b042a60a5a19c19b7a8e07e7495efa10} of outstanding share at a price of IDR 6,300. Related net profit post transaction costs and Federal royalty reached AED 430 million. Earnings per share (EPS) reached AED 0.28 representing an increase of 28{e1f18614b95d3cd6e4b3128e1cd15d99b042a60a5a19c19b7a8e07e7495efa10} as compared to last year and 20{e1f18614b95d3cd6e4b3128e1cd15d99b042a60a5a19c19b7a8e07e7495efa10} change from the second quarter of 2012.
CAPEX
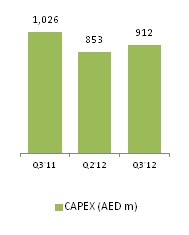
Consolidated capital expenditures declined year-over-year by 11{e1f18614b95d3cd6e4b3128e1cd15d99b042a60a5a19c19b7a8e07e7495efa10} to AED 912 million resulting in capital intensity ratio of 11{e1f18614b95d3cd6e4b3128e1cd15d99b042a60a5a19c19b7a8e07e7495efa10}, 2 point lower than prior year. Capex level in 2012 were impacted by the deconsolidation of Indian operation and slower FTTH investment as compared to prior year. Capital spending during the quarter focused on enhancing coverage and deployment of 3G networks and expanding LTE rollout. In the UAE, capital spending in the quarter reached AED 305 million, representing a decrease of 17{e1f18614b95d3cd6e4b3128e1cd15d99b042a60a5a19c19b7a8e07e7495efa10} over the same period of last year. Capital investment focused on ensuring 4G leadership. In Egypt, capital expenditures declined by 3{e1f18614b95d3cd6e4b3128e1cd15d99b042a60a5a19c19b7a8e07e7495efa10} to AED 298 million as compared to the same period of last year resulting in a capital intensity ratio of 23{e1f18614b95d3cd6e4b3128e1cd15d99b042a60a5a19c19b7a8e07e7495efa10}. In Africa cluster, capital expenditure declined by 42{e1f18614b95d3cd6e4b3128e1cd15d99b042a60a5a19c19b7a8e07e7495efa10} to AED 114 million resulting in a capital intensity ratio of 17{e1f18614b95d3cd6e4b3128e1cd15d99b042a60a5a19c19b7a8e07e7495efa10}. In Asia, capital expenditure declined by 14{e1f18614b95d3cd6e4b3128e1cd15d99b042a60a5a19c19b7a8e07e7495efa10} to AED 120 million impacted by the deconsolidation of the Indian operation. During the quarter, deployment continued of the 3G networks in Afghanistan and Ivory Coast.
Debt
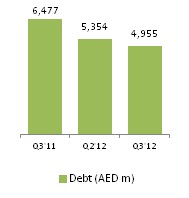
Total consolidated debt reached AED 4,955 million, representing a decline of 23{e1f18614b95d3cd6e4b3128e1cd15d99b042a60a5a19c19b7a8e07e7495efa10} in comparison to debt balance as of September 2011. Main reason for the decline is the deconsolidation of the Indian operation. Most of the existing debt is related to international operations to finance networks deployment and the majority of the balance is for long term maturity. Consolidated cash balance reached AED 12,176 million as of September 2012 leading to a positive net cash of AED 7,221 million after deducting the debt balance.
| Balance Sheet Summary |
|||||||||||||||||||||
|
|||||||||||||||||||||
| Cash flow Summary |
|||||||||||||||||||||
|
Reconciliation of Non-IFRS Financial Measurements
We believe that EBITDA is a measurement commonly used by companies, analysts and investors in the telecommunications industry, which enhances the understanding of our cash generation ability and liquidity position, and assists in the evaluation of our capacity to meet our financial obligations. We also use EBITDA as an internal measurement tool and, accordingly, we believe that the presentation of EBITDA provides useful and relevant information to analysts and investors. Our EBITDA definition includes revenue, staff costs, direct cost of sales, regulatory expenses, operating lease rentals, repairs and maintenance, general financial expenses, and other operating expenses. EBITDA is not a measure of financial performance under IFRS, and should not be construed as a substitute for net earnings (loss) as a measure of performance or cash flow from operations as a measure of liquidity. The following table provides a reconciliation of EBITDA, which is a non-IFRS financial measurement, to Operating Profit before Federal Royalty, which we believe is the most directly comparable financial measurement calculated and presented in accordance with IFRS.
|
|||||||||||||||||||||||||||||||||||||


